Loomwork · № 014
Observability for agents that act and spend
·5 min·Loomwork
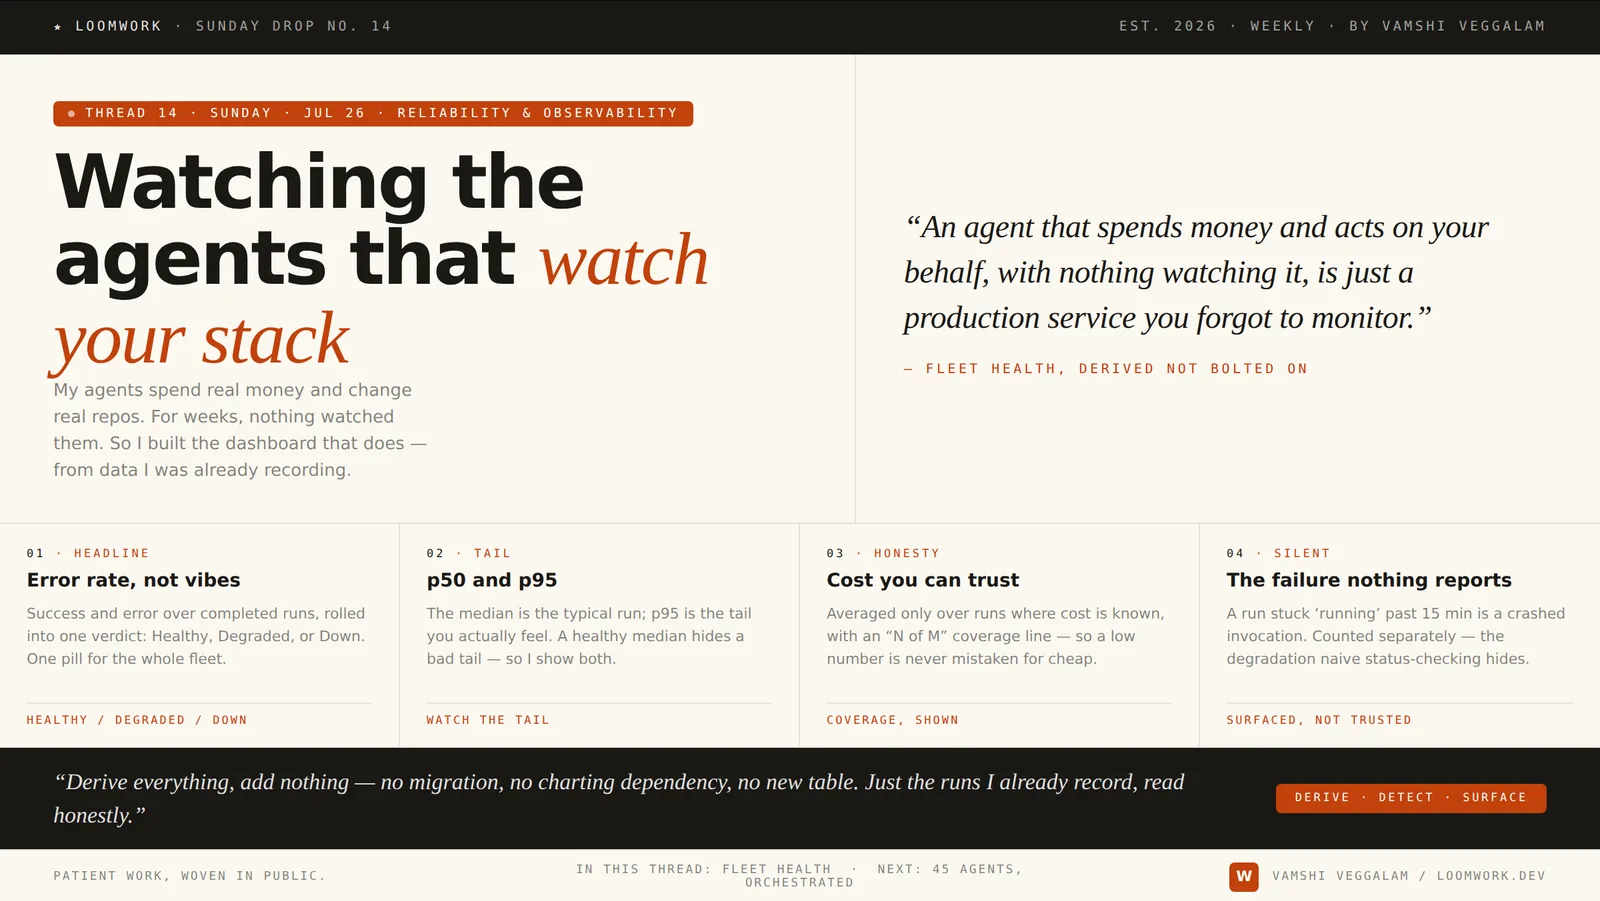
Patient work, woven in public.
This is Thread 14 of Loomwork. New here? Thread 01 explains why this newsletter exists — 2 minutes. Last week was about letting an agent act — comment on a PR, open an issue, behind four gates. This week is about the question that comes right after you let something act: how do you know it's still healthy?
I’ve built a registry of 48 specialist agents — roughly one per tool a stack might contain — plus a master chief-of-staff that synthesizes what they find. Five run against my own stack today; the rest activate the moment a credential is connected. A scheduler wakes every hour and runs each user’s fleet once, at their local hour. They watch your stack: your PRs, your deploys, your issues. And for a while, the embarrassing truth was that nothing watched them. An agent that spends real money and takes real actions, with no monitoring, isn't a feature. It's a production service you forgot to instrument. So I built a fleet-health view — and the interesting decisions weren't about drawing charts. They were about refusing to let the numbers lie.
Derive everything. Add nothing.
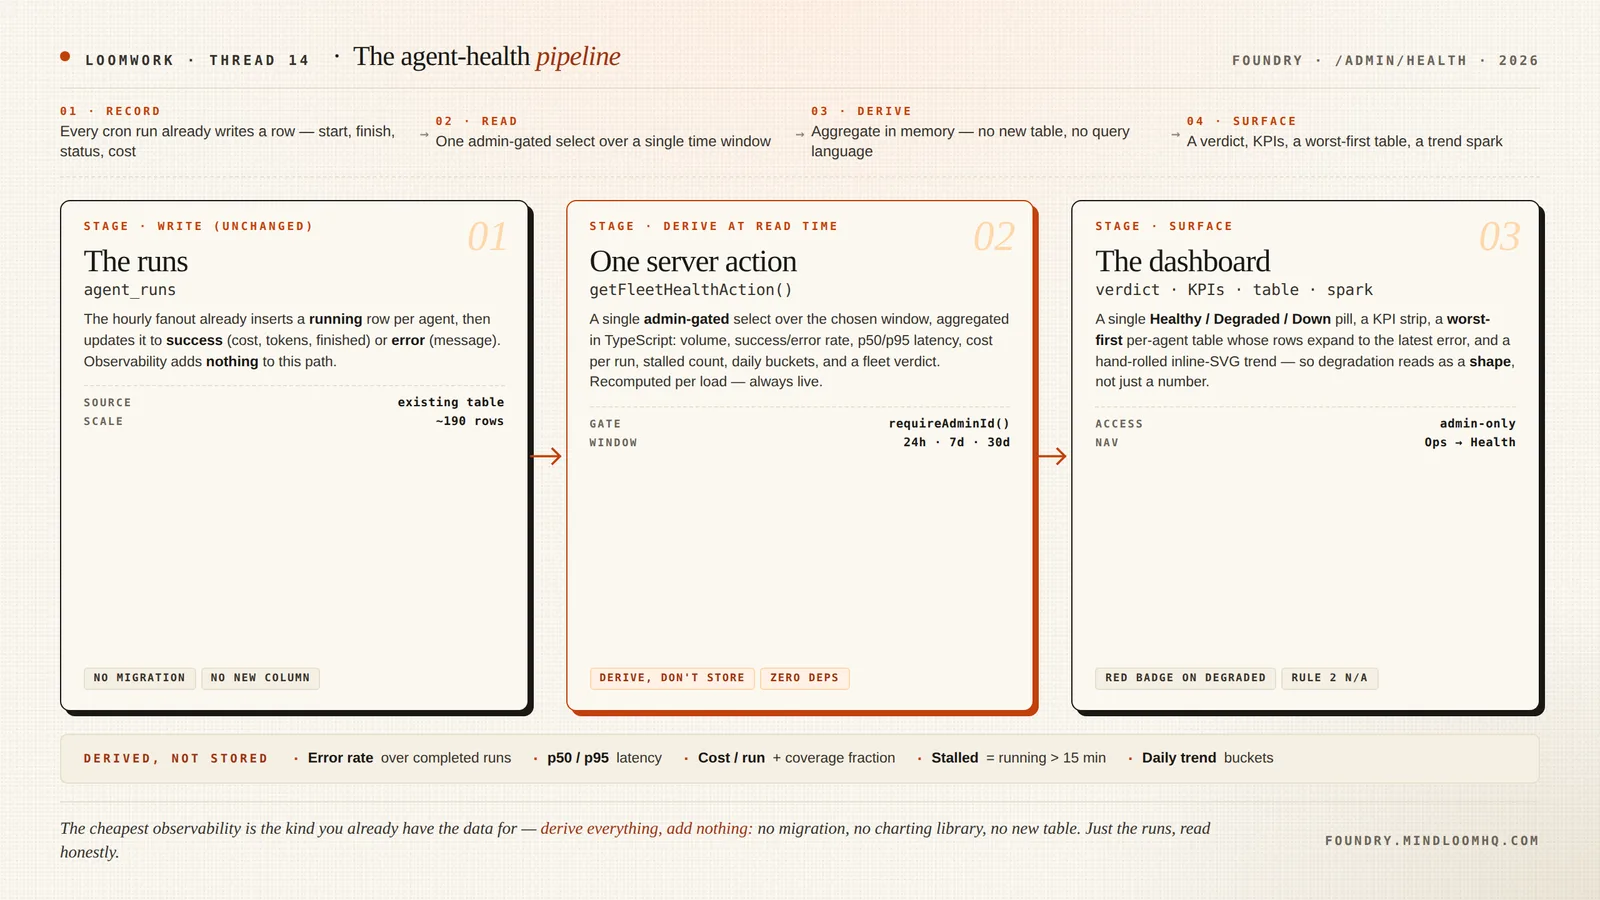
The first decision was where the data lives. Every agent run already writes a row: when it started, when it finished, whether it succeeded, what it cost, how many tokens, and — on failure — the error. Every metric I wanted was already sitting in that table. So the whole dashboard is one admin-only query over a single time window, aggregated in memory. No new table. No migration. No charting dependency.
I weighed two heavier options and rejected both. A charting library (recharts, visx, tremor) would draw prettier trend lines — but it adds a dependency, inflates the bundle on an admin route, and risks fighting the house palette in dark mode. A hand-rolled inline-SVG spark is enough for a health trend and stays on-brand. A Postgres view or materialized daily aggregate would be the "correct" answer at scale — but at a couple hundred rows it's premature, and it adds a migration and a sync surface to maintain forever. Both were solving a scale problem I don't have yet. The revisit trigger is written down: past ~100k runs, or when the page feels slow, move the math into the database. Not before.
The metrics that actually tell you something.
Error rate is the headline — successes over completed runs, so in-flight work never dilutes it. But a single rate is a trap, so the view shows p50 and p95 latency side by side. The median is the typical run; p95 is the tail you actually feel. A perfectly healthy median can sit on top of a p95 that's quietly tripled — and the tail is where degradation lives. Cost is per-run and total, over the window.
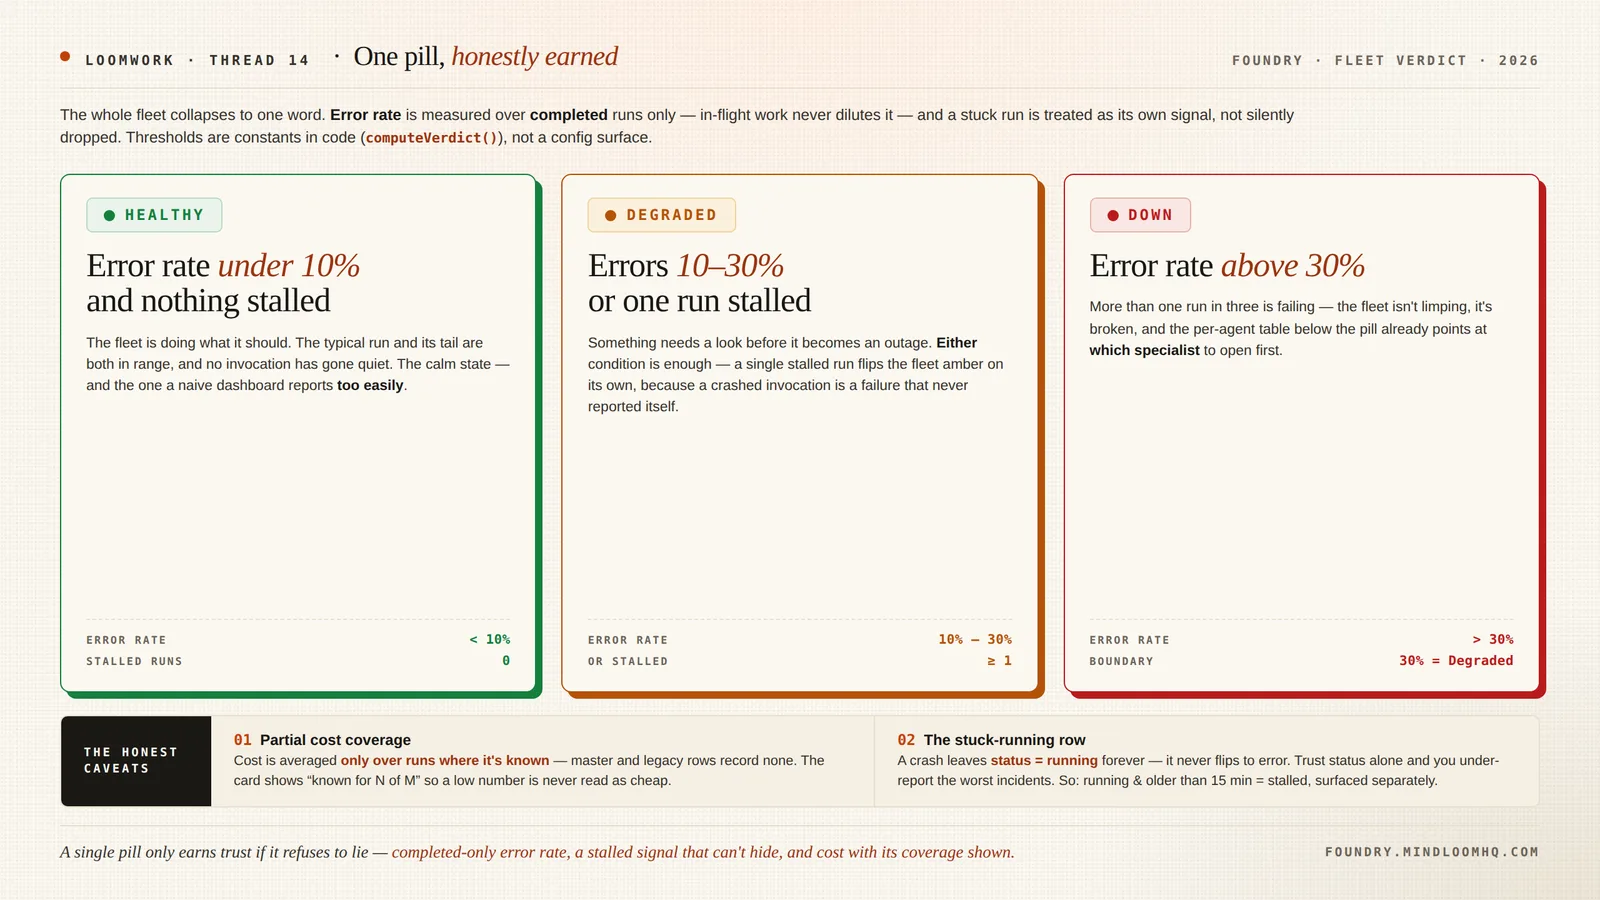
Then the whole thing collapses to one pill: Healthy under 10% errors with nothing stalled, Degraded at 10–30% or a single stalled run, Down above 30%. Those thresholds are constants in the code, not a config surface — one fewer knob to get wrong at 3 a.m. Below the pill, a per-agent table sorted worst-first: the specialist that needs attention is at the top, so you scan, you don't hunt.
The two places the data lies — and what I did about it.
First, cost coverage is partial. The master agent and the older dogfood runs record no cost, so if you naively average cost across every row you understate it. Cost is computed only over runs where the cost is known, and the card prints the coverage — "known for N of M runs" — so a low number is never mistaken for a cheap one.
Second, the stuck run. When a serverless invocation crashes mid-run, its row never flips to error — it sits at running forever. Trust status alone and those rows are invisible, which means the naive dashboard hides exactly your worst incidents behind a wall of green. So any run still running past 15 minutes — longer than any real run; the observed p95 is about 26 seconds, so the threshold is ~35× the tail — is treated as stalled, counted as its own first-class signal, and it alone can flip the fleet to Degraded. A failure that never reported itself is still a failure.
The bug this feature shipped with — and the gate it bought.
Fitting, for an observability thread: the observability page broke production three times before it was right. A helper in the health module was a plain (non-async) export inside a server-actions file — something tsc, ESLint, and the smoke tests all waved through, but that the production build rejects. Three Vercel deploys failed before the pattern was obvious. The fix was one line — stop exporting the helper — but the real fix was systemic: a new static check now runs before every push, so that whole class of error can't reach the build again. A red deploy is a bad afternoon; a missing guardrail is every future afternoon.
What I'm deliberately not doing yet.
This dashboard is pull, not push — you open it; it doesn't page you. No alerting thresholds wired to Slack or a phone yet, no anomaly detection, no per-user health (it's an admin, fleet-wide view). Those are real gaps, and they're next — but a truthful pull dashboard you can trust beats a push alert built on numbers that quietly lie. I'd rather earn the trust first and automate the paging second.
Instrument what you already record, show the tail not just the average, and be loud about where the data is thin. That's the difference between running a fleet of agents and hoping about one.
— Vamshi
Loomwork is by Vamshi Krishna Veggalam. Building Foundry at mindloomhq.com, with the full archive at loomwork.dev. Find me on LinkedIn.
This thread first ran on LinkedIn on July 26, 2026 — the conversation is over there. Read it on LinkedIn and join the thread